The bull market in stocks, starting in March 2009 after the global financial crisis and ending recently with the outbreak of the coronavirus, was the longest bull run in US history. It was also the most unloved. Investors of many stripes were so focused on risks – the European debt crisis, Brexit, the election of Donald Trump. tensions in the Middle East, a trade war between the world’s two biggest economies and riots in Hong Kong – that they forgot to participate in the stock market.
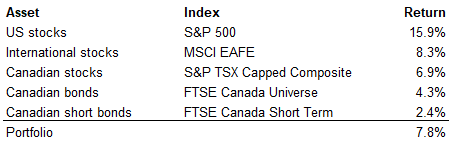
Over the course of the last decade, long-term investors were well rewarded for taking on the risk of owning common stocks. Below are the returns of major asset classes from 2010 to 2019 (annualized total returns in Canadian dollars). The benchmark portfolio has equal weight in the five assets given below (the portfolio is 60% stocks and 40% bonds).
Many Canadian charities did not achieve anything near this return over the last decade. We see many charities in the 3-4% range, which is less than a standard required return of 5.5% (spending of 3.5% plus inflation of 2%). These numbers can seem rather abstract to charities, who understandably do not spend much of their time monitoring the capital markets. Let’s imagine a charity had invested $1 million at the start of 2010 and held to the end of 2019, assuming no contributions or withdrawals. With an annualized return of 3% from a typical portfolio, they would have ended up with about $1.3 million. With an annualized return of 7.8% from a benchmark portfolio, they would have ended up with about $2.1 million. The benchmark portfolio earned an extra $800,000, for each $1 million invested. For a charity with a $10 million fund, this amounts to an extra $8 million, to buy new hospital equipment, renovate classrooms or launch new community programs.
Why did so many Canadian charities achieve less than the benchmark return? Part of the reason is fees and costs, especially if holding mutual funds. Part of the reason is cash inflows and outflows (many charities spent 4-5% of the portfolio each year, reducing the funds available for investment). Yet the main reason is asset allocation. Charities typically had less than 60% in stocks (often much less, around 30%); they invested mostly or exclusively in Canadian stocks (avoiding US or international stocks); and they held a large amount of cash (instead of high-quality bonds).
For charities who achieved a return of more than 7.8% over the last decade with a reasonable level of risk, we offer our congratulations. For those who achieved a middling return of 4-6%, we provide a wake-up call. If they struggled to maintain purchasing power in a decade-long bull market, one wonders what will happen in less favourable conditions. And for the many charities who ended up in the 1-4% range, we issue a challenge to raise their game for the new decade. Even though returns will likely be lower in the 2020s, charities will generally be well served by taking a long-term approach with long-term funds. This is especially true for charities that expect to be around for decades to come.