Investing lessons from the coronavirus

As of March 17, 2020, the World Health Organization has estimated that 179,111 people worldwide have been infected with the coronavirus, including 91,779 in the Western Pacific (51.2% of total), 64,188 in Europe (35.8% of total) and 4,910 in the Americas (2.7% of total). Deaths worldwide are estimated at 7,426 (4.1% of those infected). I emphasize “estimated”, since many cases of the virus have mild symptoms and do not end up being captured in the data.  

The virus has almost certainly sent the global economy into recession, shuttering airports, hotels and restaurants and closing the US-Canada border to non-essential travel. In the midst of this public health challenge, quite understandably, not many people are thinking about the long term. Yet recognizing that “this too shall pass”, we wanted to share some lessons about long-term investing that charities can learn from current events.

High-quality bonds

We have been emphasizing the importance of high-quality, short- to mid-term bonds for quite a while. This is what protects the portfolio in tough times and ultimately allows charities to take measured risks where they are more likely to be rewarded – with stocks. There are serious risks in “reaching for yield” with bond substitutes. Below we compare the year-to-date performance of high-quality bonds and low-quality bonds (fund total returns at market price, as at March 17, 2020):

Canadian short-term federal bonds (ZFS): 2.8%
Canadian short-term bonds (VSB): -1.6%
Canadian low-rated corporate bonds (HYB): -14.8%
Canadian preferred shares (ZPR): -31.0%

The performance of bond substitutes, in Warren Buffett’s phrase, shows who has been swimming without their shorts. Canadian stocks have returned -25.1% year-to-date. Imagine if a charity were unlucky enough to hold a portfolio of 50% Canadian stocks and 50% preferred shares. Their year-to-date return would be about -28%. Try starting the year with $1 million and losing $280,000 within a matter of months, when you thought you were playing it safe. Quite a rude awakening!

Global stocks

Canadian charities, just as much as other Canadian investors, have a pronounced “home bias” in their investments. This means that they invest far more in Canadian securities than they should. This home bias is prompted by a number of impulses, including that Canadian companies seem more familiar, Canadian investments are made within a democratic country governed by the rule of law, a need to maintain liquidity in Canadian dollars to meet regular expenses and a desire to support Canadian companies. Below we compare the year-to-date performance of Canadian, US and international stocks (the last two are currency-unhedged, with exposure to the movement of foreign currencies):

US stocks (ZSP): -14.3%
International developed stocks (ZEA): -21.3%
Canadian stocks (XIC): -25.1%

Safe and familiar Canadian stocks have exhibited the lowest return and high volatility, with Canada’s export-oriented economy pummeled by the coronavirus and the oil price.

US dollar

This leads us to the question of currency exposure. A significant part of the stronger performance of US stocks is because of the role of the US dollar. During extreme events like the dot-com crash of 2000-01, the global financial crisis of 2008-09 and the coronavirus, large global investors like insurance companies and pension funds move parts of their portfolios from stocks to bonds, seeking the safety of US Treasury bonds and the staying power of the global reserve currency. In 2001 and 2002, the US dollar rose 3.7% and 5.9% respectively against the Canadian dollar. In 2008, the gain was a more dramatic 22.2%. In 2020 year-to-date, the US dollar has surged 9.1% against the Canadian dollar and could see further gains as the impact of the coronavirus extends over the spring and summer. The point here is similar to foreign stocks. Although it seems more risky to have exposure to foreign currencies, this often helps Canadian investors reduce risk during stock market downturns. The Canadian dollar is highly exposed to the global trade cycle, while the US dollar benefits from the flight to safety of global investors. The currency decision makes a difference. Safe and familiar Canadian stocks lost 25.1%, while bad old US stocks lost 14.3%. A big part of this difference was the US dollar.

Asset mix

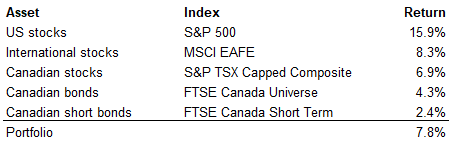
The above points apply to charities who are investing, which we would define as at least 40% of the portfolio in stocks. Yet the most important point we make today is for charities who are either not investing, or barely investing with 20-30% of the portfolio in stocks. Over the last decade, a typical charity’s portfolio earned 3% annualized, while a benchmark 60/40 portfolio earned 7.8% annualized (see previous post). Let’s say a charity invested $1 million at the start of 2010 and held to the end of 2019, assuming no contributions or withdrawals. With the 3% annualized return of a typical portfolio, the ending balance would be $1.3 million. With the 7.8% annualized return of a benchmark portfolio, the ending balance would be $2.1 million. The higher return of the benchmark portfolio was worth an extra $800,000, for each $1 million invested. This is not free money. It has to be earned, by having generous donors and funders, by having engaged board members, by considering how the funds will support the organization’s long-term objectives, by developing a careful Investment Policy Statement and by investing patiently for the long term. The process is not meant to be easy, since it involves sticking to a plan during periods of considerable uncertainty. The key point from this post is that charities who are currently holding most of their long-term funds in cash or GICs should not be too quick to congratulate themselves. Certainly, they have been insulated from the extreme volatility of this year’s markets. But they have also been insulated from the 7.8% annualized growth of a benchmark portfolio over the last decade. Even with all the challenges of 2020, charities should not forget about long-term objectives. Where do they want to be in 2030? Do they have the right investments to help them get there?

The 2010s in review

The bull market in stocks, starting in March 2009 after the global financial crisis and ending recently with the outbreak of the coronavirus, was the longest bull run in US history. It was also the most unloved. Investors of many stripes were so focused on risks – the European debt crisis, Brexit, the election of Donald Trump. tensions in the Middle East, a trade war between the world’s two biggest economies and riots in Hong Kong – that they forgot to participate in the stock market.

Over the course of the last decade, long-term investors were well rewarded for taking on the risk of owning common stocks. Below are the returns of major asset classes from 2010 to 2019 (annualized total returns in Canadian dollars). The benchmark portfolio has equal weight in the five assets given below (the portfolio is 60% stocks and 40% bonds).

Many Canadian charities did not achieve anything near this return over the last decade. We see many charities in the 3-4% range, which is less than a standard required return of 5.5% (spending of 3.5% plus inflation of 2%). These numbers can seem rather abstract to charities, who understandably do not spend much of their time monitoring the capital markets. Let’s imagine a charity had invested $1 million at the start of 2010 and held to the end of 2019, assuming no contributions or withdrawals. With an annualized return of 3% from a typical portfolio, they would have ended up with about $1.3 million. With an annualized return of 7.8% from a benchmark portfolio, they would have ended up with about $2.1 million. The benchmark portfolio earned an extra $800,000, for each $1 million invested. For a charity with a $10 million fund, this amounts to an extra $8 million, to buy new hospital equipment, renovate classrooms or launch new community programs.

Why did so many Canadian charities achieve less than the benchmark return? Part of the reason is fees and costs, especially if holding mutual funds. Part of the reason is cash inflows and outflows (many charities spent 4-5% of the portfolio each year, reducing the funds available for investment). Yet the main reason is asset allocation. Charities typically had less than 60% in stocks (often much less, around 30%); they invested mostly or exclusively in Canadian stocks (avoiding US or international stocks); and they held a large amount of cash (instead of high-quality bonds).

For charities who achieved a return of more than 7.8% over the last decade with a reasonable level of risk, we offer our congratulations. For those who achieved a middling return of 4-6%, we provide a wake-up call. If they struggled to maintain purchasing power in a decade-long bull market, one wonders what will happen in less favourable conditions. And for the many charities who ended up in the 1-4% range, we issue a challenge to raise their game for the new decade. Even though returns will likely be lower in the 2020s, charities will generally be well served by taking a long-term approach with long-term funds. This is especially true for charities that expect to be around for decades to come.

Why your accounting firm is not publicly-traded

In most parts of the world, accountants, lawyers and other professional firms typically operate as limited liability partnerships or privately-held companies but almost never as publicly-traded corporations. This is partly because professional services firms are people-intensive businesses that do not scale easily to provide substantial returns on capital. But the main reason is that, if professional firms were to be publicly-listed, there would be a natural conflict of interest between making money for shareholders and upholding the standards of a regulated profession.

Returns versus regulations

Imagine engaging a publicly-traded accounting firm to carry out an audit. When the audit partners have to answer to their shareholders and their professional regulators, which master would they serve? Would the auditors diligently carry out all the sampling and fact-checking required of a thorough audit? Or would they be inclined to cut corners, sign off and move on the next client, to maximize their billable hours? This is already an issue in privately-held accounting practices but would become a true conflict in a publicly-traded accounting firm.

The curious case of banks

When it comes to investing, banks have managed to position themselves as professional advisors, even though their role is a hybrid of shareholder interests and professional standards. When working with a non-fiduciary bank advisor, typically about half of the fees reward the shareholders of a publicly-traded corporation, while about half of the fees are retained by the individual advisor. Even though advisors have good intentions, they are influenced by products, incentives and banking culture to promote investments that benefit the bank and are “suitable” for the client, rather than in the client’s best interest. An example of this is preferred shares, which we discussed in a recent blog post. Preferred shares, because they have lower returns and higher risks than bonds, are typically not recommended by professional investment firms but are promoted by advisors who benefit from a lucrative split of the 3% underwriting fee with their bank.

Implications

Charitable boards, who have a fiduciary responsibility for the organization’s funds, should consider partnering with a professional investment manager that provides the same fiduciary standard of care. Would you work with an accounting firm or law firm if it were a publicly-traded corporation? Probably not. Yet foundations and charities often choose to work with non-fiduciary bank advisors for their investments, without fully considering the inherent conflict of interest – between making money for shareholders and upholding professional standards – that lies below the surface of the bank’s well-polished brand.

Unpreferred shares

Over the years, we have noticed that preferred shares, often held as a substitute for bonds, are popular investments for foundations and charities. We will explain what preferred shares are, what role they play in a portfolio and why they are widely held – arguably far more widely held than they should be.

What are preferred shares?

Preferred shares are often thought of as a hybrid of stocks and bonds. Although preferred shares sit above common shares in the capital structure of a corporation, they sit below bonds and other debt obligations. In the event of bankruptcy, bondholders are paid before shareholders, while in the event of financial difficulty that causes a corporation to cut its dividend, preferred shareholders have first claim on dividends. Most preferred shares in Canada are rate-reset preferreds, with dividends set at a premium to Canada five-year bonds. Given the hybrid role of preferreds, one might expect to see returns that are not as defensive as bonds but not as aggressive as stocks. Let’s see if this is the case.

What role do they play?  

Below we see the performance of bonds (FTSE Canada Universe Bond Index) versus preferreds (S&P TSX Preferred Share Index), in the 10-year period from 2008 to 2017:

Two years stand out. In 2008, during the global financial crisis, bonds gained 6.4% while preferreds lost 16.9% (difference of 23.3%). In 2015, a year of moderate losses for Canadian stocks, bonds gained 3.5%, while preferreds lost 15% (difference of 18.5%). These two years highlight the fundamental problem of preferreds – they do not protect against losses in the stock market. In addition, the returns of preferreds compared to bonds were 1.6% lower and their volatility almost four times higher. This picture of lower return and higher risk becomes even clearer when we look at a benchmark portfolio of 60% stocks (S&P TSX Capped Composite) and 40% bonds. The first portfolio actually holds bonds (FTSE Canada Universe Bond Index), while the second portfolio holds preferreds instead of bonds (S&P TSX Preferred Share Index). Again, this is for the 10-year period from 2008 to 2017:

It is one thing to incur losses from stocks during a bad year like 2008. This is simply part of earning the equity risk premium – the higher expected return that comes from investing in stocks. It is quite another thing to see large losses from the “bond” portion of the portfolio at the same time. A loss of 17% is perhaps manageable for some institutions but a loss of 27% is likely to come with some behavioural cost, such as panic-selling, missing out on gains when the market recovers and losing confidence in a long-term investment plan.

Economics explains a good part of the reason why preferreds perform poorly when the stock market declines. During a stock market crash, the economy often falls into recession. When this happens, the Bank of Canada generally cuts interest rates, to encourage businesses to invest and consumers to spend. Yet preferreds, because of their rate-reset structure, work in the other direction, typically performing well when rates rise (in expectation of higher dividends) and performing poorly when rates fall (in expectation of lower dividends). Investors who want short-term stability from bonds should be uncomfortable with bond substitutes like preferreds that are economically structured to perform poorly during a stock market crash.

Why are they widely held?

Part of the reason why preferreds are widely held is the “reach for yield” in a decade of low interest rates. Since endowments and foundations often hold about half of their assets in bonds and cash, returns as low as 1% for cash start to chafe after a while and encourage investors to take on more risk as they seek higher yield. The reach for yield can take many forms, including not just preferred shares but also common shares in utilities, pipelines and consumer staples – sectors that are considered by some (unwisely in our view) as bond substitutes. Yet while part of the reason for the popularity of preferreds has to do with demand from investors, another part has to do with supply from financial intermediaries, especially big banks. In Canada, preferred shares are often listed in an Initial Public Offering for $25. This is after a fee of $0.75 (or about 3% of proceeds) paid to the underwriting banks. In situations where a bank is advising charities or foundations, the bank advisor is typically paid about half of the 3% fee for placing the preferreds with the institution. Often the bank advisor is only held to a “suitability” standard rather than a fiduciary standard. This enables the advisor to recommend preferreds as a “suitable” investment, even though it is far from clear that preferreds meet the best interests of institutions.

Implications

The current bull market for stocks has run for 10 years and in the next downturn it is unlikely that preferred shares would provide the same protection as high-quality bonds. For institutions that need to manage short-term market risk to maintain spending, we recommend replacing preferred shares with high-quality bonds. For institutions holding more than 10% of their portfolio in preferred shares, we suggest reflecting on how this has happened, given the association of preferred shares with lower returns, higher losses during stock market crashes and potential conflicts of interest from bank advisors.

Three ways to govern

Foundations and charities can govern the investment process in one of three ways – board, finance committee or investment committee. We will explore each of these structures, suggesting when each one might be most appropriate.

1) Board

At small organizations, say with less than $1 million of long-term assets, investments are often governed by the board, since there might not be an audit, finance or investment committee. The involvement of the board is not without its advantages, as this enables the organization to consider finance and investment as it relates to the organization and its objectives, rather than as a discrete area of activity. Yet there are also several drawbacks to this approach. The lack of a dedicated finance or investment committee can mean that financial matters are not routinely discussed on the board agenda and are considered reactively with an eye to audits and filings rather than proactively with an eye to the future. It can also create challenges in recruiting accountants, bankers or corporate executives as board members, many of whom would expect to serve on a finance or investment committee.

2) Finance committee

When organizations grow beyond a small size, they often choose to govern their investments by a finance committee or investment committee. The existence of a finance committee tends to make finance a standing item on the board agenda and also helps with the recruitment of board members. However, this approach still has its challenges. When payroll, invoices, procurements and investments are all part of the same agenda, it can be difficult to dedicate time and focus for long-term capital planning. In the space of a single meeting, committee members might jump from approving a contract signed last month to considering an investment policy statement for the next five years.

3) Investment committee

When organizations reach a large size, they generally establish an investment committee. In some cases, this is a stand-alone committee reporting directly to the board, while in others it is a sub-committee of finance or audit. This enables the recruitment of highly skilled board members and a dedicated focus for long-term capital planning. Yet an investment committee is not always appropriate for medium organizations. Non-profits have to balance the potential advantages of an investment committee against increased complexity, including the time involved recruiting board members and running additional meetings.

Implications

As a rule of thumb, small organizations, especially very small ones, often go with board oversight, while medium and large ones often choose between finance committee and investment committee. Even so, it is not just the size of investments that matter but also the complexity of the organization. Non-profits with highly visible mandates (e.g. conservation) or highly engaged donors (e.g. hospitals) might wisely err on the side of more rather than less governance for their investments.

Regardless of governance structure, the board’s fiduciary responsibility is the same – to ensure that the funds are managed appropriately to meet the needs of the organization’s beneficiaries over the short and long term. Foundations and charities should consider partnering with a portfolio manager who is held to a fiduciary standard, like their board. By way of comparison, many bank advisors are not fiduciary investors (advisors are only held to a “suitability” standard), while hedge funds are lightly regulated and not held to any professional standard.

Lingua franca

In many foundations and charities, investment and long-term planning decisions are overseen by a committee – often a finance committee or sometimes an investment committee. A common challenge for small and medium institutions is abrupt variation in investment knowledge. On a typical committee of six members, we might like to think that two members have a high level of knowledge, two medium and two low. The reality is far less balanced. What we often see is that one or two committee members have a reasonably high level of investment knowledge, while the other members have minimal knowledge and sometimes little interest. This creates unrewarded risks in how institutions discuss their investments and make key investment decisions.

Investment not spoken here

When there is no common language of finance and investment, committees find it difficult to discuss investing in a thoughtful manner. Imagine the committee has decided to review its asset mix. A more experienced member wants to discuss changes in the organization’s near-term objectives and program spending, balancing this against market expectations and risks for stocks, bonds and cash. Meanwhile, less experienced members keep jumping in to discuss one aspect of the budget or a single stock. The result is a conversation that veers between the principled and the particular, often not resulting in a clear decision on the matter at hand.

Illusion of consensus

When it becomes difficult to review the investment program and make key decisions, the committee will often be dominated by one or two members. These can be the members with the most experience but they can also be the ones with the strongest opinions or loudest voices. Rather than drawing on a wide range of experience and using a common language to work through decisions, institutions risk having decisions made by one or two members and then presented as if they were made by the committee. This can give too much decision-making authority to individual members, entrench them in their own experience and create blind spots in assessing risks.

Playing together

To improve decision-making, institutions need to make variation in knowledge less abrupt between members of the committee. Instead of two members having an 80% level of knowledge and four members having a 20% level of knowledge, we bring all members up to a 50% level. We do this by selecting members who are willing to learn and then providing them with a common base of knowledge before they join the committee and particularly over the course of their first three meetings. As an example of how to improve the learning process for committee members, our firm has developed a 10-part investment guide, each part of which can be read in 10 minutes. Success with this process is not just that all committee members have a higher level of knowledge; it is that they have a common body of knowledge – a lingua franca. By providing a common body of knowledge, we increase rather than reduce the role that diversity plays in making investment decisions. When committee members are safe in the knowledge that they can talk about asset mix, inflation and other investment matters in a way that their colleagues understand, they are more enabled to share their own insight, more equipped to question assumptions and more engaged in the investment process. These seemingly “soft” factors of human behaviour have a large and lasting impact on the quality of investment decisions made by charitable institutions.

Hard and soft factors in investing

At a high level, investing for institutions consists of hard and soft factors. The hard factor is related to finance – how to set an asset allocation and select securities in a portfolio. The soft factor is related to behaviour – how to understand the personal characteristics of board or investment committee members and engage them in the investing process. To ask which factor is more important is difficult to say, since they are – or at least should be – closely related. Yet the question is important and we will try to answer it.

Rocket scientist or social worker?

As a thought experiment, let’s contrast two extreme cases – investing done by a rocket scientist or a social worker. The rocket scientist is technically brilliant at finance but not very good at dealing with people, while the social worker is remarkably skilled in understanding human relationships but doesn’t know much about finance. Our rocket scientist has designed an algorithm that she believes can generate a 16% annualized return while greatly limiting losses. Our social worker, recognizing he doesn’t know that much about finance, has selected a handful of index funds, which he understands could generate a 6% annualized return, even though he’s not sure of that. Who’s likely to generate a better return for a charitable institution over the next 10 years?

Rocket science gone wrong

Clearly, there will be cases when a rocket-science system can produce remarkable results, if the underlying process is sound and has enough time to bear fruit. Yet there will also be cases when the rocket-science system has violent swings, looks very different from a regular portfolio and, most important of all, scares the living daylights out of a committee who took the whole system on trust and never really understood it in the first place. The risk of the rocket scientist under-performing the social worker comes from the committee changing or abandoning the strategy during this period of stress. In comparison, if the social worker uses all his skill to explain the investment process to committee members and engage them in the ownership of the investing process, there is a reasonable chance they will stay the course and actually capture the benefits of the social worker’s admittedly more modest-looking investment system.

What would Warren do?

Most institutions should not have to choose between an investment professional who is good with numbers or good with people. But imagine if we did have to choose, so that we could only get the benefits of one approach by losing some of the benefits of the other approach. This means we could either 1) retain a brilliant investment system but lose some of the social worker’s skill in dealing with people or 2) retain a remarkable ability to understand human relationships but lose some of the rocket scientist’s skill in designing an investment system. When put this way, I suspect that many institutions would realize that the second option is the better choice. The choice serves to illustrate the point made by Warren Buffett: “Investing is not a game where the guy with the 160 IQ beats the guy with the 130 IQ. Once you have ordinary intelligence, what you need is the temperament to control the urges that get other people into trouble in investing”. This applies all the more when working as part of a team to invest for the benefit of others.

When smaller is stronger

Each year, the National Association of College and University Business Officers publishes a report on the investment returns of US college endowments. The report is widely followed, since institutions like Harvard and Yale are considered to be among the most sophisticated investors in a highly competitive market. Yet recent experience does not inspire much confidence in the investment methods of the Ivy League. The report shows a negligible difference between the investment returns of large and small institutions. It also shows that many endowments have underperformed a simple index portfolio of 60% stocks and 40% bonds.

The rise and fall of alternatives

The poor performance of large institutions is explained by two points. First, the larger the institution, the greater the allocation to alternative assets, such as hedge funds and venture capital. Second, alternative assets have not done well in recent years. The reason for this declining performance is “over-grazing”. What started as pioneering portfolio management under David Swensen at Yale is now the mainstream. Demand for alternatives has outpaced the supply of worthwhile investments. Some institutions have simply tried to copy the tactics of the Yale investment program, without fully considering its underlying strategy. While on the surface, the tactics might appear to suggest allocating more to alternatives, the strategy is more complex and nuanced. We argue that the strategy consists of deeply reflecting on where a sustained advantage can be found for a long-term investor and then patiently building an organizational capability, culture and reputation that enables the institution to exploit that advantage. In the past, the strategy implied an allocation to alternatives but in the future it could imply something different. Merely trying to copy the tactics without deeply understanding the strategy will lead not only to disappointing results but also unforeseen risks. One of the signal examples of this was the University of Toronto endowment and pension fund, which lost 30% in the market crash of 2008.

Bucking the trend

The conventional thinking is that large institutions should outperform their smaller peers, because of the size of their assets, experience of their investment teams and preferred access to deals. We want to invert this conventional approach and suggest that small and medium institutions are well placed to outperform their larger peers over the next decade, assuming the Ivy League continues to allocate heavily to alternatives. Small institutions, if they admit that alternatives are outside their “circle of competence”, will benefit from the following:

  • Cost. Small institutions will refuse to pay management fees of 2% or more, when a simple solution can be managed for 0.5% or less. This difference of 1.5% is a high hurdle for large institutions to clear and many will fail to do so.
  • Risk. Small institutions will refuse take risks that have not been tested over periods of decades. The performance of a balanced portfolio of stocks and high-quality bonds has held up quite well for North American investors from 1929 to the present. The same cannot be said for mortgage pools, buyout deals and other opaque strategies, which often have not been tested over a single market cycle, let alone several.
  • Complexity. Small institutions will refuse to make investments that come with a 100-page offering memorandum. Just because the firm promoting the offer has a convincing pitch doesn’t indicate they understand the investment better than anyone else. In fact, the pitch is likely to be exceptional, given that it has to persuade investors to accept high costs, unknown risks and lock-up periods of 5-10 years, in exchange for a high likelihood of underperforming a simple portfolio of stocks and bonds.

If small institutions can control cost, reduce risk and keep it simple, they have a good chance of beating the returns of large institutions over the next decade. They also have the potential to exert an advantage that is often acknowledged but seldom realized – the advantage of a long time horizon. By not trying to “keep up with the Yales”, small institutions can invest to meet their own objectives over the long term.

Reflections on 2018

Last year ended in dramatic fashion, with the worst December for US stocks since 1931. This can prompt savers to become more attached to cash for safety and investors to question their approach to holding stocks and bonds. When it comes to the principles of how investment risk is rewarded, however, we suggest that 2018 was more about continuity than change. To explore this idea, let’s review the returns of the major asset classes, for the 10 years ending 2018:

Total index returns in Canadian dollars, 2009 to 2018

US: S&P 500
Emerging: MSCI Emerging Markets
EAFE: MSCI EAFE (Europe, Australasia and Far East)
Canada: S&P TSX Capped Composite
Bond: Canadian bonds
S Bond: Canadian short-term bonds
Cash: Canadian three-month Treasury bills

Change

While 2018 ended with a wild ride, the annual results were quite tame. A benchmark portfolio of 60% global stocks and 40% Canadian bonds was down about 3.6% for the year. This is a small loss by almost any standard and perhaps only seems like a surprise when compared with the fruits of a long bull market, when the same benchmark portfolio returned 10.6% annualized in the 10-year period from 2009 to 2018.

Continuity

The last decade happens to have borne out several long-term trends in financial markets.

  • Stocks beat bonds. While stock returns ranged from 14.4% for the United States to 7.9% for Canada, stocks handily beat bonds.
  • Bonds beat cash. Bond returns ranged from 4.2% for all bonds to 2.5% for short-term bonds, both much higher than cash.
  • Cash is less safe than it looks. Cash only returned 0.8%, losing purchasing power to inflation at 1.6%. In 2011 and 2018, the two worst years for stocks, cash was beaten by bonds.

Implications

Asset mix is the most important decision for long-term investors. If foundations and charities are investing for the long term, then they should consider a healthy allocation to stocks, mixed appropriately with high-quality bonds. For the many institutions that are not investing but instead saving, cash can significantly reduce long-term returns. Imagine a school or hospital had raised $10 million at the start of 2009, as part of the funding to build a new sports centre or cardiac unit. Over the next 10 years, a saver’s portfolio split between short-term bonds and cash returned 1.7%, while an investor’s portfolio, as outlined above, returned 10.6%. Hypothetically, the saver would have ended up with $11.8 million, while the investor would have ended up with $27.4 million (not adjusted for inflation, fees or costs). This is certainly not a typical case, as returns were unusually strong over the last decade. Yet in this case, deciding to invest rather than save was worth more than $15 million, enough to make a big difference to students, patients or other members of the community. Consider your long-term objectives and decide whether saving or investing is better for the community you serve.

Getting started with stocks

One would normally expect almost all long-term charitable investors to have a healthy allocation to stocks. This is not the case. Based on our analysis of 500 private Ontario foundations with at least $1 million of investment assets, we find that about 35% of foundations hold only short-term investments such as cash and GICs, avoiding long-term investments such as stocks and bonds. Some foundations have good reasons to be all-cash (typically, corporate foundations that disburse a large portion of their funds each year or foundations that anticipate winding up their operations within a few years). We estimate these foundations account for no more than 10% of the total, still leaving 25% of private foundations with a long-term investment horizon but a short-term position in cash.

The typical approach to set an asset mix consists of reviewing an institution’s investment objectives and then setting a risk tolerance based on the institution’s ability, willingness and need to accept risk. Even though a risk tolerance might suggest investing in stocks, many institutions hold back from actually investing in stocks because of complexity and cost. Below we outline a simple approach to help charitable investors get started with investing in stocks.

Getting the right mix

To provide a clear and simple example, we will make a number of assumptions. First, we will assume that a standard asset mix for long-term investors is 60% stocks and 40% bonds. Second, we will assume that some charitable investors are holding 100% cash without a clear reason for doing so. Third, we will assume that these all-cash investors would not move to 60% stocks and 40% bonds in a single leap but would take time to get there.

Starter portfolio

With these assumptions in mind, we outline the following starter portfolio:

Asset Weight in portfolio Annual cost
Canadian bonds 40% 0.10%
Canadian short bonds 40% 0.10%
Canadian stocks 20% 0.06%
Weighted annual cost   0.09%

The portfolio consists of just three assets, each represented by a single fund. The exposure to bonds is 80% and split between a broad universe of bonds (average maturity of about 10 years) and short-term bonds (average maturity of about three years). The two bond funds combined hold about 1,750 bonds, with about 70% issued by Canadian governments and 30% issued by Canadian corporations. The exposure to stocks is 20%, covering about 250 of the largest companies in Canada. All exposure is to Canadian securities only, to make for a simple investing experience without having to worry about the movements of foreign currencies such as the US dollar. Based on the mix of 80% bonds and 20% stocks, the portfolio is resilient and would have lost about 1% in 2008, the year of the global financial crisis. The holding cost of the portfolio is 0.09%, equivalent to $900 per $1 million invested. Compared to cash, the portfolio offers the potential for a higher long-term return, with relatively low risk of short-term loss.

Try this for a year

Foundations and charities currently holding cash may consider trying the starter portfolio for a year. The purpose of doing this is not to see if stocks do well but to see how simple and affordable the investing process can be. After having experienced this, institutions can then consider moving to a standard asset mix of 60% stocks and 40% bonds. This is still a simple asset mix: the stock portion is divided in three equal parts between Canadian, US and international stocks, while the bond portion holds a strong and stable mix of Canadian bonds. The journey of a thousand miles begins with a single step. In this post, we want to show how easy it can be to take the first step and get started with stocks.